Class PivotTable
A Vue component for Pivot table with pagination.
Example
<script setup lang="ts">
import { ref } from 'vue';
import { PivotTable } from '@sisense/sdk-ui-vue';
import * as DM from './sample-ecommerce';
import { measureFactory } from '@sisense/sdk-data';

const pivotTableProps = ref({
  dataOptions: {
    rows: [
      {
        column: DM.Commerce.Date.Years,
        dateFormat: 'yyyy',
        name: 'Year',
      },
      DM.Commerce.Condition,
    ],
    columns: [DM.Commerce.AgeRange],
    values: [measureFactory.sum(DM.Commerce.Revenue, 'Total Revenue')],
  },
  styleOptions: {
    rowsPerPage: 10,
    height: 425,
    width: 800,
  },
});
</script>

<template>
  <PivotTable
    :dataSet="DM.DataSource"
    :dataOptions="pivotTableProps.dataOptions"
    :styleOptions="pivotTableProps.styleOptions"
  />
</template>
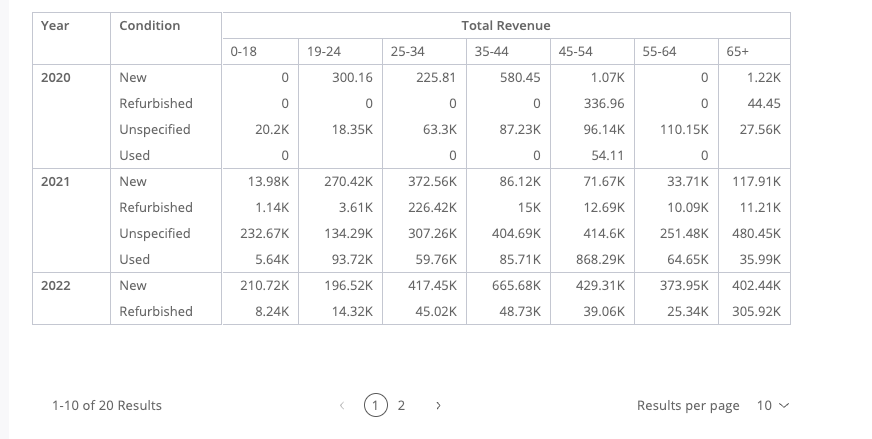
Additional examples:
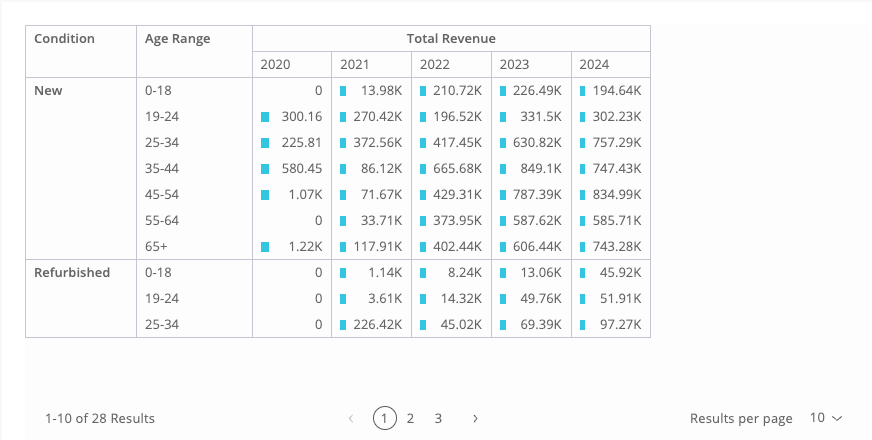
Highlighting relative magnitude within a column with data bars:
<script setup lang="ts">
import { ref } from 'vue';
import { PivotTable } from '@sisense/sdk-ui-vue';
import * as DM from './sample-ecommerce';
import { measureFactory } from '@sisense/sdk-data';

const pivotTableProps = ref({
  dataOptions: {
    rows: [DM.Commerce.Condition, DM.Commerce.AgeRange],
    columns: [
      {
        column: DM.Commerce.Date.Years,
        dateFormat: 'yyyy',
        name: 'Year',
      },
    ],
    values: [
      {
        column: measureFactory.sum(DM.Commerce.Revenue, 'Total Revenue'),
        dataBars: true,
      },
    ],
  },
  styleOptions: {
    rowsPerPage: 10,
    height: 425,
    width: 850,
  },
});
</script>

<template>
  <PivotTable
    :dataSet="DM.DataSource"
    :dataOptions="pivotTableProps.dataOptions"
    :styleOptions="pivotTableProps.styleOptions"
  />
</template>
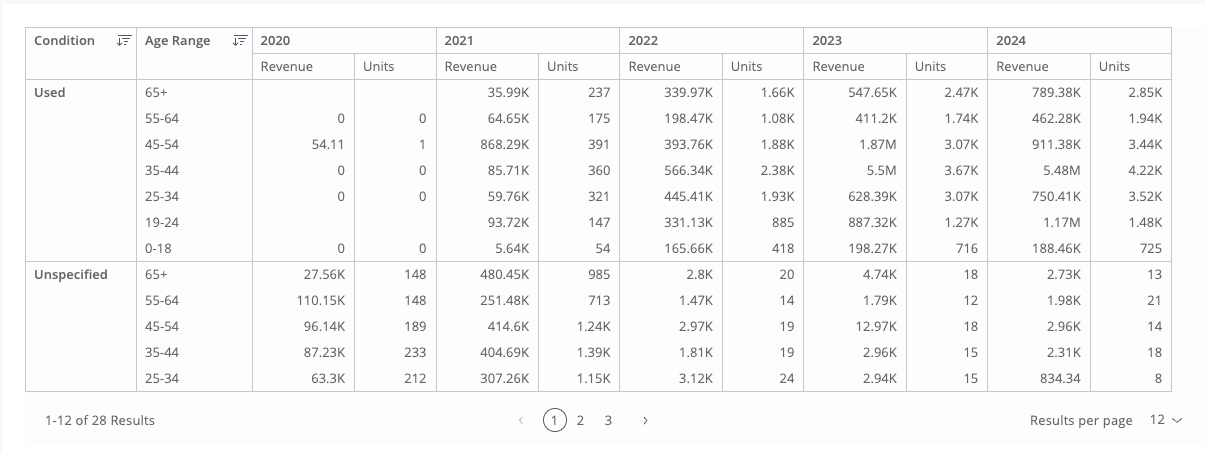
Sorting rows: Condition and Age Range rows sorted directly by their own values (equivalent to a user clicking a row heading and choosing Sort Descending):
<script setup lang="ts">
import { ref } from 'vue';
import { PivotTable } from '@sisense/sdk-ui-vue';
import * as DM from './sample-ecommerce';
import { measureFactory } from '@sisense/sdk-data';

const pivotTableProps = ref({
  dataOptions: {
    rows: [
      {
        column: DM.Commerce.Condition,
        sortType: 'sortDesc',
      },
      {
        column: DM.Commerce.AgeRange,
        sortType: 'sortDesc',
      },
    ],
    columns: [{ column: DM.Commerce.Date.Years }],
    values: [
      { column: measureFactory.sum(DM.Commerce.Revenue, 'Revenue') },
      { column: measureFactory.sum(DM.Commerce.Quantity, 'Units') },
    ],
  },
  styleOptions: {
    rowsPerPage: 12,
    height: 425,
    width: 1200,
  },
});
</script>

<template>
  <PivotTable
    :dataSet="DM.DataSource"
    :dataOptions="pivotTableProps.dataOptions"
    :styleOptions="pivotTableProps.styleOptions"
  />
</template>
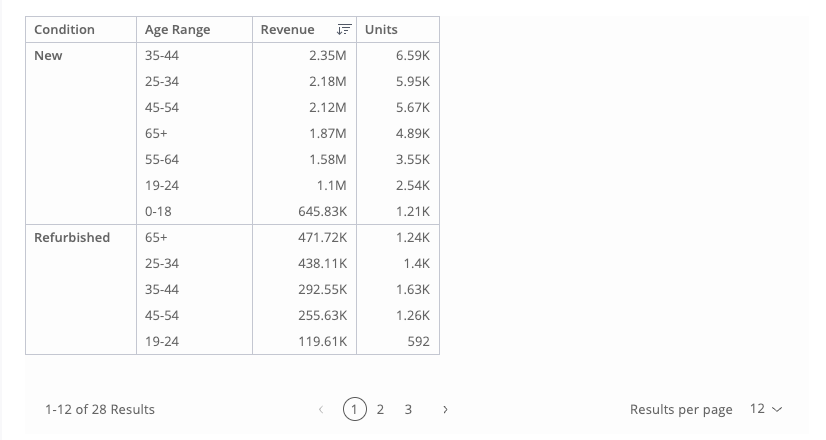
Sorting rows by a value column: Age Range sorted by its Revenue values (equivalent to a user clicking the Revenue value heading and sorting Age Range Descending):
<script setup lang="ts">
import { ref } from 'vue';
import { PivotTable } from '@sisense/sdk-ui-vue';
import * as DM from './sample-ecommerce';
import { measureFactory } from '@sisense/sdk-data';

const pivotTableProps = ref({
  dataOptions: {
    rows: [
      DM.Commerce.Condition,
      {
        column: DM.Commerce.AgeRange,
        sortType: {
          direction: 'sortDesc',
          by: {
            valuesIndex: 0,
          },
        },
      },
    ],
    values: [
      measureFactory.sum(DM.Commerce.Revenue, 'Revenue'),
      measureFactory.sum(DM.Commerce.Quantity, 'Units'),
    ],
  },
  styleOptions: {
    rowsPerPage: 12,
    height: 425,
    width: 800,
  },
});
</script>

<template>
  <PivotTable
    :dataSet="DM.DataSource"
    :dataOptions="pivotTableProps.dataOptions"
    :styleOptions="pivotTableProps.styleOptions"
  />
</template>
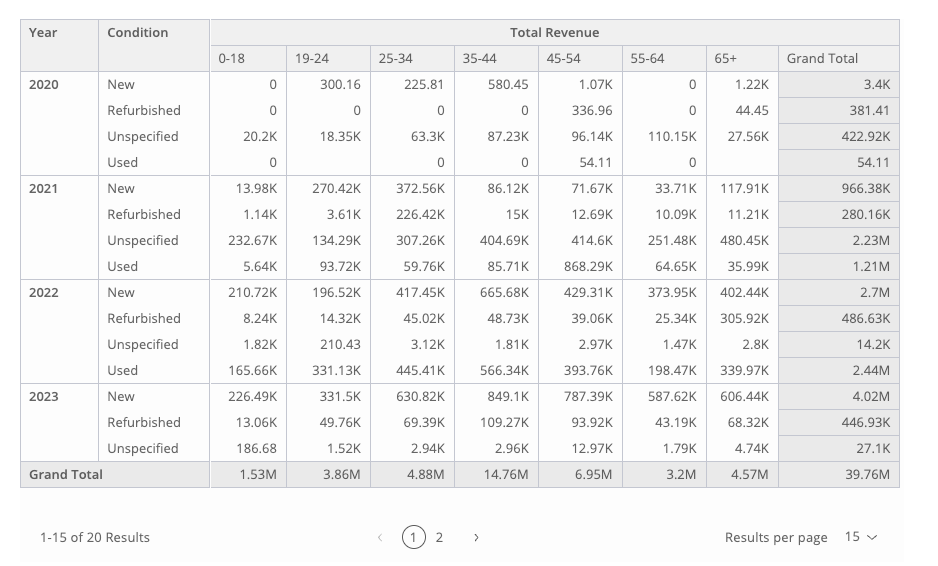
Grand totals across rows and columns:
<script setup lang="ts">
import { ref } from 'vue';
import { PivotTable } from '@sisense/sdk-ui-vue';
import * as DM from './sample-ecommerce';
import { measureFactory } from '@sisense/sdk-data';

const pivotTableProps = ref({
  dataOptions: {
    rows: [
      {
        column: DM.Commerce.Date.Years,
        dateFormat: 'yyyy',
        name: 'Year',
      },
      DM.Commerce.Condition,
    ],
    columns: [DM.Commerce.AgeRange],
    values: [measureFactory.sum(DM.Commerce.Revenue, 'Total Revenue')],
    grandTotals: {
      rows: true,
      columns: true,
    },
  },
  styleOptions: {
    rowsPerPage: 15,
    height: 550,
    width: 900,
    totalsColor: true,
    headersColor: true,
  },
});
</script>

<template>
  <PivotTable
    :dataSet="DM.DataSource"
    :dataOptions="pivotTableProps.dataOptions"
    :styleOptions="pivotTableProps.styleOptions"
  />
</template>
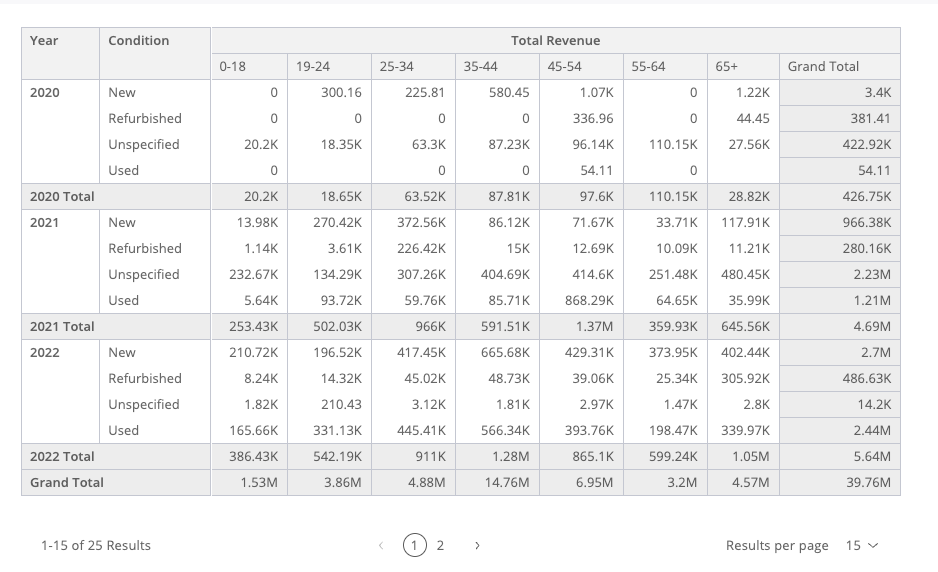
Grand totals plus a subtotal row per Year, via PivotTableDataOptions.rows' includeSubTotals:
<script setup lang="ts">
import { ref } from 'vue';
import { PivotTable } from '@sisense/sdk-ui-vue';
import * as DM from './sample-ecommerce';
import { measureFactory } from '@sisense/sdk-data';

const pivotTableProps = ref({
  dataOptions: {
    rows: [
      {
        column: DM.Commerce.Date.Years,
        dateFormat: 'yyyy',
        name: 'Year',
        includeSubTotals: true,
      },
      DM.Commerce.Condition,
    ],
    columns: [DM.Commerce.AgeRange],
    values: [measureFactory.sum(DM.Commerce.Revenue, 'Total Revenue')],
    grandTotals: {
      rows: true,
      columns: true,
    },
  },
  styleOptions: {
    rowsPerPage: 15,
    height: 550,
    width: 900,
    totalsColor: true,
    headersColor: true,
  },
});
</script>

<template>
  <PivotTable
    :dataSet="DM.DataSource"
    :dataOptions="pivotTableProps.dataOptions"
    :styleOptions="pivotTableProps.styleOptions"
  />
</template>
Remarks
Configuration options can also be applied within the scope of a <SisenseContextProvider> to control the default behavior of PivotTable, by changing available settings within appConfig.chartConfig.tabular.*
Follow the link to AppConfig for more details on the available settings.
Properties
Data
dataOptions
readonlydataOptions:PivotTableDataOptions
Configurations for how to interpret and present the data passed to the component
dataSet
readonlydataSet?:DataSource
Data source name (as a string) - e.g. Sample ECommerce.
If not specified, the component will use the defaultDataSource specified in the parent Sisense Context.
filters
readonlyfilters?:FilterRelations|Filter[]
Filters that will slice query results
highlights
readonlyhighlights?:Filter[]
Filters that will highlight query results.
NOTE that highlight filters in the "Include all" state are silently omitted from the query. To clear a highlight, remove it from the array.
Callbacks
onDataPointClick
readonlyonDataPointClick?:PivotTableDataPointEventHandler
Callback function that is called when the pivot table cell is clicked
onDataPointContextMenu
readonlyonDataPointContextMenu?:PivotTableDataPointEventHandler
Callback function that is called when the pivot table cell is right-clicked
Representation
styleOptions
readonlystyleOptions?:PivotTableStyleOptions
Configurations for how to style and present a pivot table's data.