# Class ChartWidget
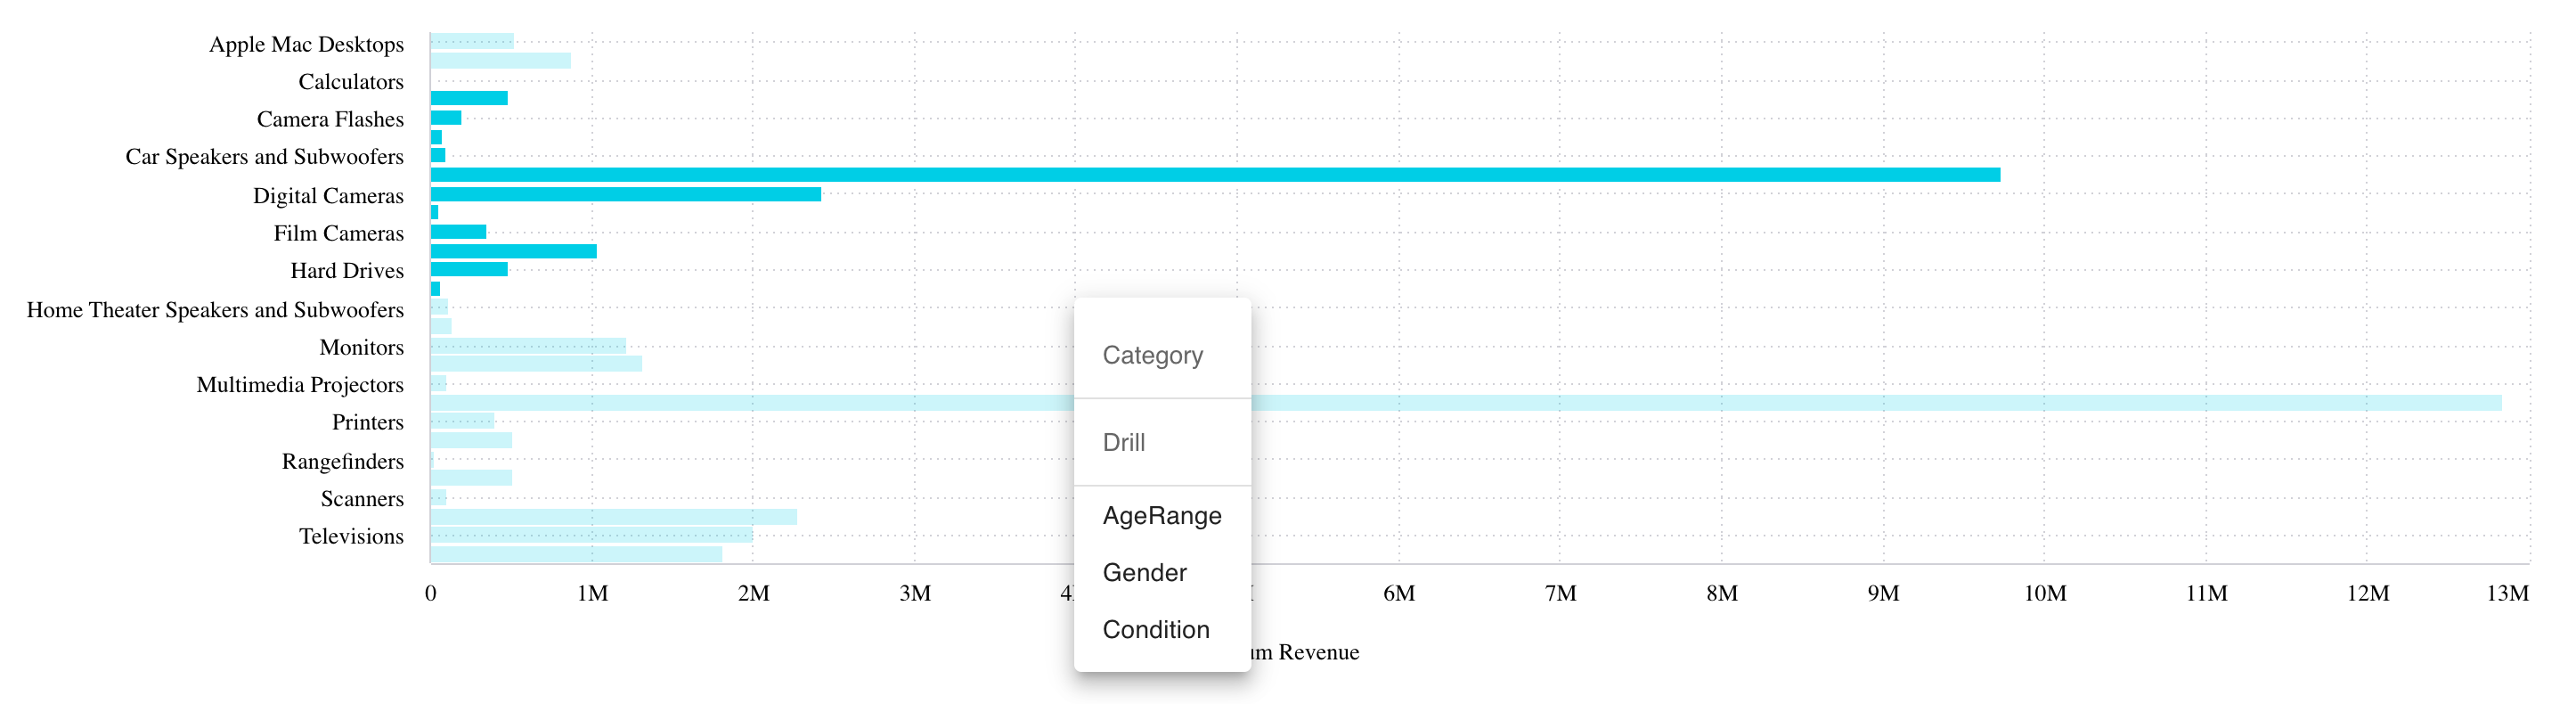
The Chart Widget component extending the Chart component to support widget style options. It can be used along with the DrilldownWidget component to support advanced data drilldown.
# Example
Here's how you can use the ChartWidget component in a Vue application:
<template>
   <DrilldownWidget :drilldownDimensions="drilldownDimensions" :initialDimension="dimProductName">
     <template
       #chart="{ drilldownFilters, drilldownDimension, onDataPointsSelected, onContextMenu }"
     >
       <ChartWidget
         chart-type="bar"
         v-bind:filters="drilldownFilters"
         :dataOptions="{
           ...chartProps.dataOptions,
           category: [drilldownDimension],
         }"
         :highlight-selection-disabled="true"
         :dataSet="chartProps.dataSet"
         :style="chartProps.styleOptions"
         :on-data-points-selected="(dataPoints:any,event:any) => {
         onDataPointsSelected(dataPoints);
         onContextMenu({ left: event.clientX, top: event.clientY });
       }"
         :on-data-point-click="(dataPoint:any,event:any) => {
         onDataPointsSelected([dataPoint]);
         onContextMenu({ left: event.clientX, top: event.clientY });
       }"
         :on-data-point-context-menu="(dataPoint:any,event:any) => {
         onDataPointsSelected([dataPoint]);
         onContextMenu({ left: event.clientX, top: event.clientY });
       }"
       />
     </template>
   </DrilldownWidget>
</template>

<script setup lang="ts">
import { ref } from 'vue';
import { measureFactory, filterFactory } from '@sisense/sdk-data';
import * as DM from '../assets/sample-retail-model';
import { ChartWidget } from '@sisense/sdk-ui-vue';

const dimProductName = DM.DimProducts.ProductName;
const measureTotalRevenue = measureFactory.sum(DM.Fact_Sale_orders.OrderRevenue, 'Total Revenue');
const chartWidgetProps = ref({
  // Configure your ChartWidgetProps here
});
</script>
# Param
ChartWidget properties
# Properties
# Data
# dataSource
readonlydataSource?:DataSource
Data source the query is run against - e.g. Sample ECommerce
If not specified, the query will use the defaultDataSource specified in the parent Sisense Context.
# filters
readonlyfilters?:FilterRelations|Filter[]
Filters that will slice query results
# highlights
readonlyhighlights?:Filter[]
Highlight filters that will highlight results that pass filter criteria
# Chart
# chartType
readonlychartType?:ChartType
Default chart type of each series
# dataOptions
readonlydataOptions?:ChartDataOptions
Configurations for how to interpret and present the data passed to the chart
# Widget
# description
readonlydescription?:string
Description of the widget
# highlightSelectionDisabled
readonlyhighlightSelectionDisabled?:boolean
Boolean flag whether selecting data points triggers highlight filter of the selected data
Recommended to turn on when the Chart Widget component is enhanced with data drilldown by the Drilldown Widget component
If not specified, the default value is false
# styleOptions
readonlystyleOptions?:ChartWidgetStyleOptions
Style options for both the chart and widget including the widget header
# title
readonlytitle?:string
Title of the widget
# Callbacks
# onBeforeRender
readonlyonBeforeRender?:BeforeRenderHandler|IndicatorBeforeRenderHandler
A callback that allows you to customize the underlying chart element before it is rendered. The returned options are then used when rendering the chart.
This callback is not supported for Areamap Chart, Scattermap Chart, Table, and PivotTable.
# onDataPointClick
readonlyonDataPointClick?:AreamapDataPointEventHandler|BoxplotDataPointEventHandler|DataPointEventHandler|ScatterDataPointEventHandler|ScattermapDataPointEventHandler
Click handler callback for a data point
# onDataPointContextMenu
readonlyonDataPointContextMenu?:BoxplotDataPointEventHandler|DataPointEventHandler|ScatterDataPointEventHandler
Context menu handler callback for a data point
# onDataPointsSelected
readonlyonDataPointsSelected?:DataPointsEventHandler|ScatterDataPointsEventHandler
Handler callback for selection of multiple data points