Class TableComponent
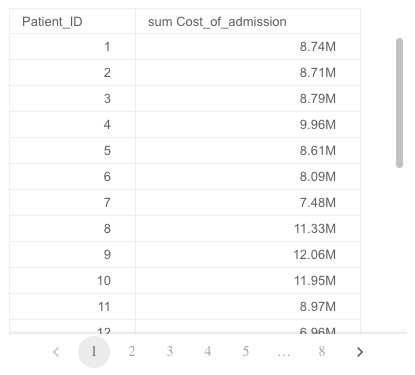
Table with aggregation and pagination.
Example
<csdk-table [dataSet]="table.dataSet" [dataOptions]="table.dataOptions" [filters]="filters" />
import { Component } from '@angular/core';
import { measureFactory, filterFactory } from '@sisense/sdk-data';
import * as DM from '../../assets/sample-healthcare-model';

@Component({
 selector: 'app-analytics',
 templateUrl: './analytics.component.html',
 styleUrls: ['./analytics.component.scss'],
})
export class AnalyticsComponent {
 DM = DM;
 filters = [filterFactory.members(DM.Divisions.Divison_name, ['Cardiology', 'Neurology'])];
 table = {
   dataSet: DM.DataSource,
   dataOptions: {
     columns: [DM.Admissions.Patient_ID, measureFactory.sum(DM.Admissions.Cost_of_admission)],
   },
 };

}
Implements
AfterViewInitOnChangesOnDestroy
Constructors
constructor
new TableComponent(
sisenseContextService,themeService):TableComponent
Parameters
| Parameter | Type |
|---|---|
sisenseContextService | SisenseContextService |
themeService | ThemeService |
Returns
Properties
Data
dataOptions
dataOptions:
TableDataOptions
Configurations for how to interpret and present the data passed to the component
dataSet
dataSet:
Data|DataSource|undefined
Data set for a chart using one of the following options. If neither option is specified, the chart will use the defaultDataSource specified in the parent SisenseContextProvider component.
(1) Sisense data source name as a string. For example, 'Sample ECommerce'. Typically, you retrieve the data source name from a data model you create using the get-data-modelcommand of the Compose SDK CLI. The chart connects to the data source, executes a query, and loads the data as specified in dataOptions, filters, and highlights.
To learn more about using data from a Sisense data source, see the Compose SDK Charts Guide.
OR
(2) Explicit Data, which is made up of an array of Column objects and a two-dimensional array of row data. This approach allows the chart component to be used with any data you provide.
To learn more about using data from an external data source, see the Compose SDK Charts Guide.
Example data in the proper format:
const sampleData = {
  columns: [
    { name: 'Years', type: 'date' },
    { name: 'Quantity', type: 'number' },
    { name: 'Units', type: 'number' },
  ],
  rows: [
    ['2019', 5500, 1500],
    ['2020', 4471, 7000],
    ['2021', 1812, 5000],
    ['2022', 5001, 6000],
    ['2023', 2045, 4000],
  ],
};
filters
filters:
FilterRelations|Filter[] |undefined
Filters that will slice query results
Callbacks
dataReady
dataReady: (
data) =>Data|undefined
A callback that allows to modify data immediately after it has been retrieved. It can be used to inject modification of queried data.
Representation
styleOptions
styleOptions:
TableStyleOptions|undefined
Configurations for how to style and present a table's data.