Function KpiChart
KpiChart(
props):Promise<ReactNode> |ReactNode
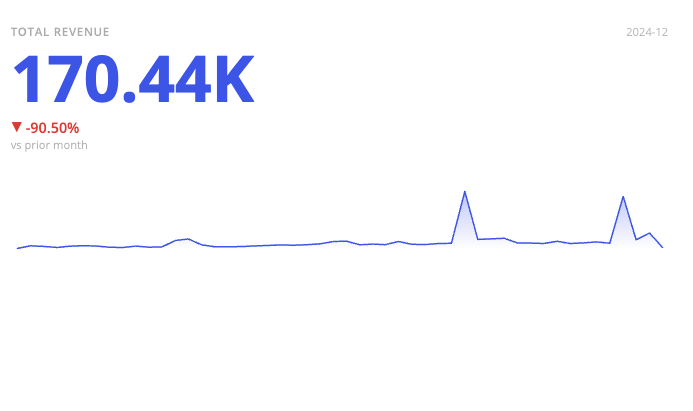
A React component that displays a single headline metric as a card, optionally with a sparkline of its trend and a readout comparing it against a baseline.
Given just a measure, the card shows that number on its own. Adding a category — typically a date dimension — gives it a sparkline and a caption for the period being shown. Adding a comparison makes it also report how the metric moved: against the previous period, against a second measure, or against a target.
Parameters
| Parameter | Type | Description |
|---|---|---|
props | KpiChartProps | KPI chart properties |
Returns
Promise< ReactNode > | ReactNode
KPI Chart component
Example
import { KpiChart } from '@sisense/sdk-ui';
import * as DM from './sample-ecommerce';
import { measureFactory } from '@sisense/sdk-data';

const CodeExample = () => {
  return (
    <KpiChart
      dataSet={DM.DataSource}
      dataOptions={{
        value: measureFactory.sum(DM.Commerce.Revenue, 'Total Revenue'),
        category: DM.Commerce.Date.Months,
        comparison: { type: 'previous-period' },
      }}
      styleOptions={{
        sparkline: { chartType: 'area' },
        height: 250,
      }}
    />
  );
};

export default CodeExample;