Function ChartWidget
ChartWidget(
props):Promise<ReactNode> |ReactNode
The Chart Widget component extending the Chart component to support widget style options. It can be used along with the DrilldownWidget component to support advanced data drilldown.
Parameters
| Parameter | Type | Description |
|---|---|---|
props | ChartWidgetProps | ChartWidget properties |
Returns
Promise< ReactNode > | ReactNode
ChartWidget component representing a chart type as specified in ChartWidgetProps.chartType
Example
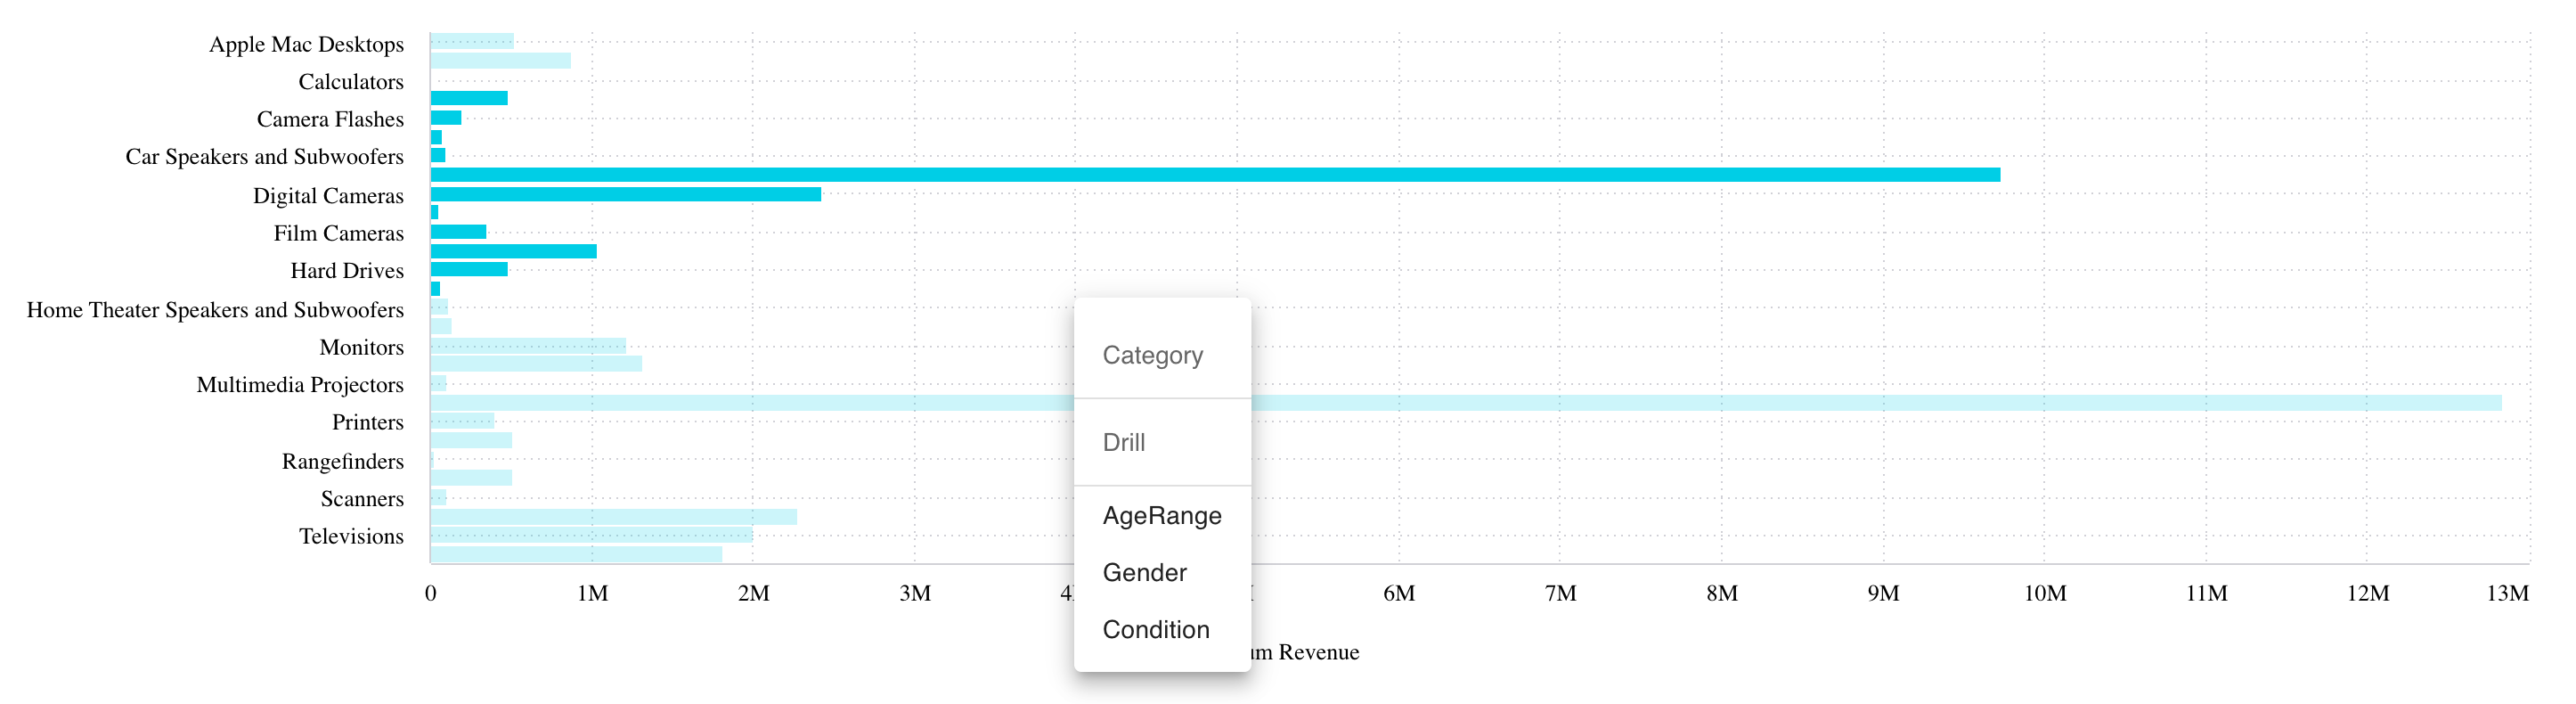
Example of using the ChartWidget component to plot a bar chart of the Sample ECommerce data source hosted in a Sisense instance.
<ChartWidget
  dataSource={DM.DataSource}
  chartType="bar"
  dataOptions={{
    category: [DM.Category.Category],
    value: [measureFactory.sum(DM.Commerce.Revenue)],
    breakBy: [],
  }}
/>