Class KpiChartComponent
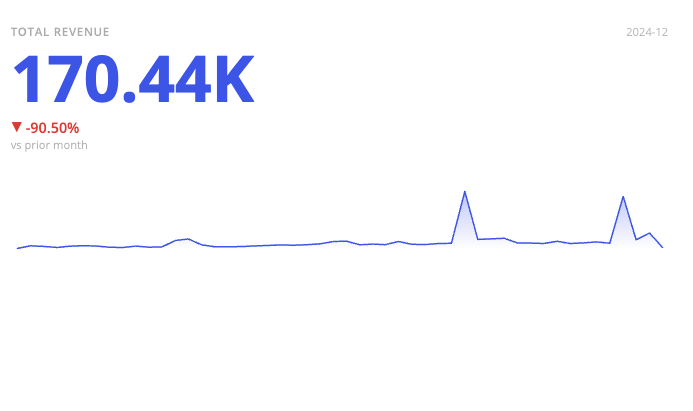
An Angular component that displays a single headline metric as a card, optionally with a sparkline of its trend and a readout comparing it against a baseline.
Given just a measure, the card shows that number on its own. Adding a category — typically a date dimension — gives it a sparkline and a caption for the period being shown. Adding a comparison makes it also report how the metric moved: against the previous period, against a second measure, or against a target.
Example
import { Component } from '@angular/core';
import * as DM from './sample-ecommerce';
import { measureFactory } from '@sisense/sdk-data';

@Component({
  selector: 'code-example',
  template: `
    `<csdk-kpi-chart
      [dataSet]="DM.DataSource"
      [dataOptions]="dataOptions"
      [styleOptions]="styleOptions"
    >` `</csdk-kpi-chart>`
  `,
})
export class CodeExample {
  DM = DM;
  dataOptions = {
    value: measureFactory.sum(DM.Commerce.Revenue, 'Total Revenue'),
    category: DM.Commerce.Date.Months,
    comparison: { type: 'previous-period' },
  };
  styleOptions = {
    sparkline: { chartType: 'area' },
    height: 250,
  };
}
Constructors
constructor
new KpiChartComponent():
KpiChartComponent
Returns
Properties
Data
dataSet
dataSet:
Data|DataSource|undefined
Data set for a chart using one of the following options. If neither option is specified, the chart will use the defaultDataSource specified in the parent SisenseContextProvider component.
(1) Sisense data source name as a string. For example, 'Sample ECommerce'. Typically, you retrieve the data source name from a data model you create using the get-data-modelcommand of the Compose SDK CLI. The chart connects to the data source, executes a query, and loads the data as specified in dataOptions, filters, and highlights.
To learn more about using data from a Sisense data source, see the Compose SDK Charts Guide.
OR
(2) Explicit Data, which is made up of an array of Column objects and a two-dimensional array of row data. This approach allows the chart component to be used with any data you provide.
To learn more about using data from an external data source, see the Compose SDK Charts Guide.
Example data in the proper format:
const sampleData = {
  columns: [
    { name: 'Years', type: 'date' },
    { name: 'Quantity', type: 'number' },
    { name: 'Units', type: 'number' },
  ],
  rows: [
    ['2019', 5500, 1500],
    ['2020', 4471, 7000],
    ['2021', 1812, 5000],
    ['2022', 5001, 6000],
    ['2023', 2045, 4000],
  ],
};
filters
filters:
FilterRelations|Filter[] |undefined
Filters to limit (or slice) a chart’s data using one of the following options.
(1) Array of Filter or FilterRelations returned from filter factory functions, such as greaterThan() and members().
Use this option for filters that do not require a UI to set them or for filters where you will supply your own UI components or use pre-built UI components. This is the most common option.
To learn more about using filter factory functions to create filters, see the Compose SDK Charts Guide.
(2) Array of Filter controlled by filter UI components – for example MemberFilterTile.
Use this option for filters that you want your users to set using pre-built UI components.
To learn more about using filter UI components to create filters, see the Compose SDK Charts Guide.
highlights
highlights:
Filter[] |undefined
Highlights based on filter criteria to apply to a chart using one of the following options.
NOTE that the filter dimensions used in highlights must match those defined in the dataOptions of the chart. Otherwise, the filters will be applied as regular slice filters.
NOTE that highlight filters in the "Include all" state are silently omitted from the query. To clear a highlight, remove it from the array.
(1) Array of Filter returned from filter factory functions, such as greaterThan() and members().
Use this option for highlights that do not require a UI to set them or for highlights where you will supply your own UI components or use pre-built UI components. This is the most common option.
To learn more about using filter factory functions to create highlights, see the Compose SDK Charts Guide.
(2) Array of Filter controlled by filter UI components – for example MemberFilterTile.
Use this option for highlights that you want your users to set using pre-built UI components.
To learn more about using filter components to create highlights, see the Compose SDK Charts Guide.
Chart
dataOptions
dataOptions:
KpiChartDataOptions
Configurations for how to interpret and present the data passed to the chart
styleOptions
styleOptions:
KpiStyleOptions|undefined
Configurations for how to style and present a chart's data.
Callbacks
beforeRender
beforeRender:
KpiBeforeRenderHandler|undefined
A callback that allows you to customize the computed KPI render options before the card is rendered. The returned options are used for painting.
dataPointClick
dataPointClick:
EventEmitter<KpiDataPointEvent>
Click handler callback for the KPI card.
dataPointContextMenu
dataPointContextMenu:
EventEmitter<KpiDataPointEvent>
Context menu handler callback for the KPI card.
dataReady
dataReady: (
data) =>Data|undefined
A callback that allows you to modify the retrieved data before the KPI card is computed from it. Whatever the callback returns is what the card is built from.
This is the data-level hook, applied to the raw query result — use it to rescale, patch, or filter values. To adjust the already computed card instead, use the render-level onBeforeRender.
The data passed in is the query result, so its shape follows how the KPI queried it:
- One query — the usual case. The data holds one row per
categorybucket, or a single row when nocategoryis configured. - Two queries —
valueMode: 'total'combined with acategory. A whole-period aggregate cannot be derived from the per-bucket rows (summing per-bucket averages, for instance, would be wrong), so it is fetched by a second, ungrouped query and merged into the same result: one extra row carrying the aggregate, plus an extra column marking which rows are buckets and which one is the total. The callback still runs once, over the already merged result.
So always spread and map the data you were given rather than rebuilding it from scratch — preserve any columns and rows you do not intend to change.